Tract-Patch Search
[1]:
from dask.distributed import Client
import lsdb
import skymap_convert
from lsdb_rubin import tract_patch_search
[2]:
client = Client(n_workers=4, memory_limit="auto")
client
[2]:
Client
Client-a4981894-a468-11f0-bb78-e4c767ffbe5f
| Connection method: Cluster object | Cluster type: distributed.LocalCluster |
| Dashboard: http://127.0.0.1:8787/status |
Cluster Info
LocalCluster
c1a11fd9
| Dashboard: http://127.0.0.1:8787/status | Workers: 4 |
| Total threads: 20 | Total memory: 31.00 GiB |
| Status: running | Using processes: True |
Scheduler Info
Scheduler
Scheduler-217aec54-4638-4aab-a748-1f0c3885601b
| Comm: tcp://127.0.0.1:45321 | Workers: 4 |
| Dashboard: http://127.0.0.1:8787/status | Total threads: 20 |
| Started: Just now | Total memory: 31.00 GiB |
Workers
Worker: 0
| Comm: tcp://127.0.0.1:41351 | Total threads: 5 |
| Dashboard: http://127.0.0.1:46781/status | Memory: 7.75 GiB |
| Nanny: tcp://127.0.0.1:43399 | |
| Local directory: /tmp/dask-scratch-space/worker-f00_hol8 | |
Worker: 1
| Comm: tcp://127.0.0.1:39261 | Total threads: 5 |
| Dashboard: http://127.0.0.1:41001/status | Memory: 7.75 GiB |
| Nanny: tcp://127.0.0.1:33149 | |
| Local directory: /tmp/dask-scratch-space/worker-6wmggf9i | |
Worker: 2
| Comm: tcp://127.0.0.1:33105 | Total threads: 5 |
| Dashboard: http://127.0.0.1:45179/status | Memory: 7.75 GiB |
| Nanny: tcp://127.0.0.1:35163 | |
| Local directory: /tmp/dask-scratch-space/worker-12reep0v | |
Worker: 3
| Comm: tcp://127.0.0.1:36093 | Total threads: 5 |
| Dashboard: http://127.0.0.1:46837/status | Memory: 7.75 GiB |
| Nanny: tcp://127.0.0.1:37231 | |
| Local directory: /tmp/dask-scratch-space/worker-6uf5h9sz | |
Load GAIA and the LSST skymap
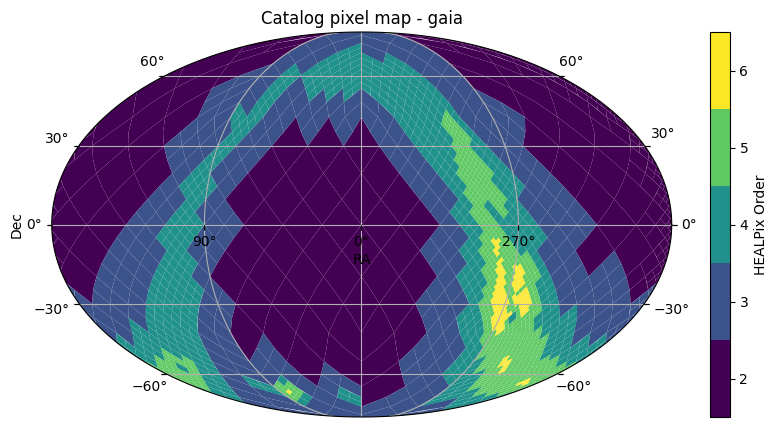
The catalog starts with 2,000+ partitions, and we can see the distribution of those partitions on the sky with the below plot. The yellow areas are the galactic bulge, where there is higher angular density of objects, and so we use smaller data partitions in the HATS catalog.
[3]:
# Load GAIA DR3 data.

gaia = lsdb.open_catalog("https://data.lsdb.io/hats/gaia_dr3", columns=["ra", "dec", "source_id"])
gaia
[3]:
| ra | dec | source_id | |
|---|---|---|---|
| npartitions=2016 | |||
| Order: 2, Pixel: 0 | double[pyarrow] | double[pyarrow] | int64[pyarrow] |
| Order: 2, Pixel: 1 | ... | ... | ... |
| ... | ... | ... | ... |
| Order: 3, Pixel: 766 | ... | ... | ... |
| Order: 3, Pixel: 767 | ... | ... | ... |
[4]:
gaia.plot_pixels()
[4]:
(<Figure size 1000x500 with 2 Axes>,
 <WCSAxes: title={'center': 'Catalog pixel map - gaia'}>)
[5]:
# Load the LSST skymap.

import skymap_convert

lsst_skymap = skymap_convert.ConvertedSkymapReader(preset="lsst_skymap")
Search by tract ID
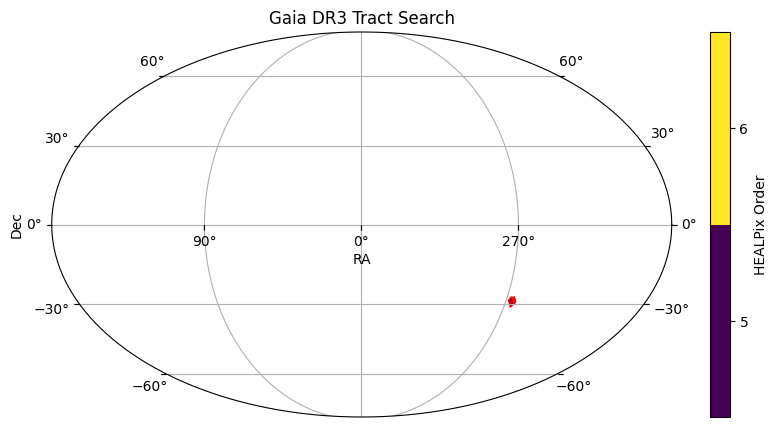
We search by a tract in the galactic bulge, and see that it overlaps with a few of the partitions in that region.
We can attach a new method called tract_patch_search, which is implemented to supplement other types of region search on the lsdb Catalog object. You can find more general information on region search in the LSDB documentation.
[6]:
from lsdb.core.plotting import plot_points
import astropy.units as u
from astropy.coordinates import SkyCoord

fov = (5 * u.deg, 5 * u.deg)
center = SkyCoord(265 * u.deg, -30 * u.deg)

tract_index = 4975
patch_index = 67
[7]:
# Only specify the tract (and not patch) to search by tract.

lsdb.catalog.Catalog.tract_patch_search = tract_patch_search

gaia_tract = gaia.tract_patch_search(skymap_reader=lsst_skymap, tract=tract_index)
gaia_tract
[7]:
| ra | dec | source_id | |
|---|---|---|---|
| npartitions=5 | |||
| Order: 5, Pixel: 7206 | double[pyarrow] | double[pyarrow] | int64[pyarrow] |
| Order: 5, Pixel: 7207 | ... | ... | ... |
| Order: 6, Pixel: 28848 | ... | ... | ... |
| Order: 6, Pixel: 28849 | ... | ... | ... |
| Order: 6, Pixel: 28852 | ... | ... | ... |
[8]:
gaia_tract.plot_pixels(
    plot_title="Gaia DR3 Tract Search",
    fc="#00000000",
    ec="red",
)
[8]:
(<Figure size 1000x500 with 2 Axes>,
 <WCSAxes: title={'center': 'Gaia DR3 Tract Search'}>)
Plot the points within our tract search
[9]:
df_tract = gaia_tract.compute()
df_tract
/home/delucchi/.virtualenvs/sep/lib/python3.12/site-packages/distributed/client.py:3383: UserWarning: Sending large graph of size 116.79 MiB.
This may cause some slowdown.
Consider loading the data with Dask directly
 or using futures or delayed objects to embed the data into the graph without repetition.
See also https://docs.dask.org/en/stable/best-practices.html#load-data-with-dask for more information.
  warnings.warn(
[9]:
| ra | dec | source_id | |
|---|---|---|---|
| _healpix_29 | |||
| 2028429617617798730 | 266.228612 | -29.751009 | 4056859222565665024 |
| 2028429623682899072 | 266.214002 | -29.750143 | 4056859222553709184 |
| ... | ... | ... | ... |
| 2030314331564457470 | 265.403714 | -28.265501 | 4060628657676158080 |
| 2030314331687825753 | 265.40231 | -28.265104 | 4060628661956658816 |
395098 rows × 3 columns
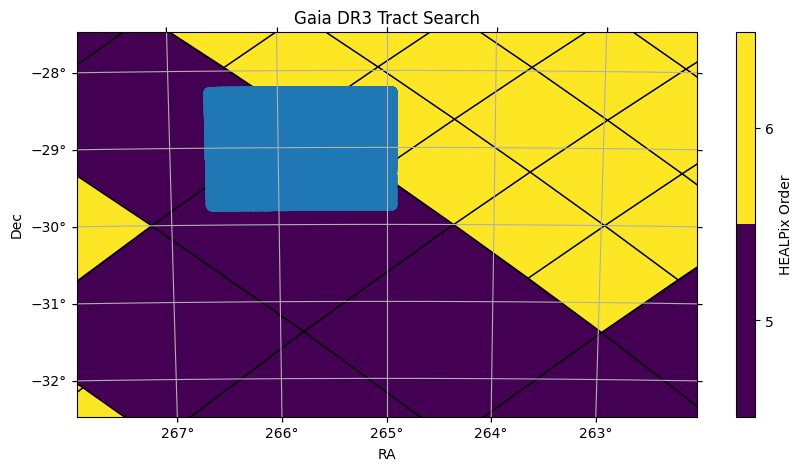
Zooming in on the tract, we can see the ~400,000 points from the catalog, in a semi-rectangular “tract-shaped” region
[10]:
fig, ax = gaia.plot_pixels(projection="AIT", fov=fov, center=center, ec="000000")
_ = plot_points.plot_points(
    df_tract,
    ra_column="ra",
    dec_column="dec",
    title="Gaia DR3 Tract Search",
    fov=fov,
    center=center,
)
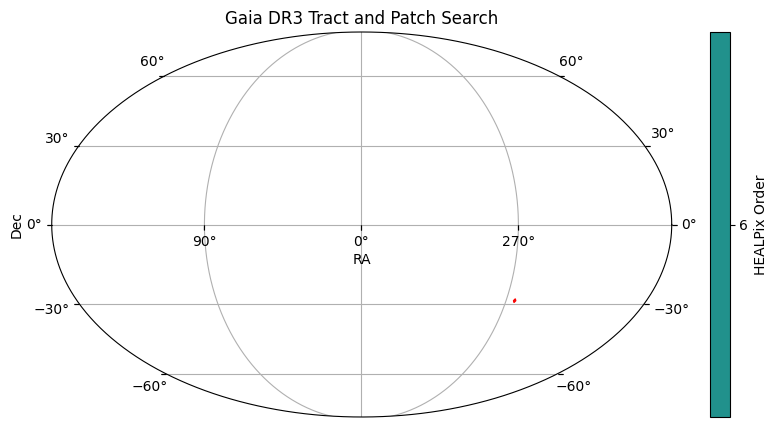
Search by patch ID
[11]:
# Specify both tract and patch to search by tract and patch.

gaia_tract_patch = gaia.tract_patch_search(
    skymap_reader=lsst_skymap,
    tract=tract_index,
    patch=patch_index,  # include patch here!
)
gaia_tract_patch
[11]:
| ra | dec | source_id | |
|---|---|---|---|
| npartitions=1 | |||
| Order: 6, Pixel: 28849 | double[pyarrow] | double[pyarrow] | int64[pyarrow] |
[12]:
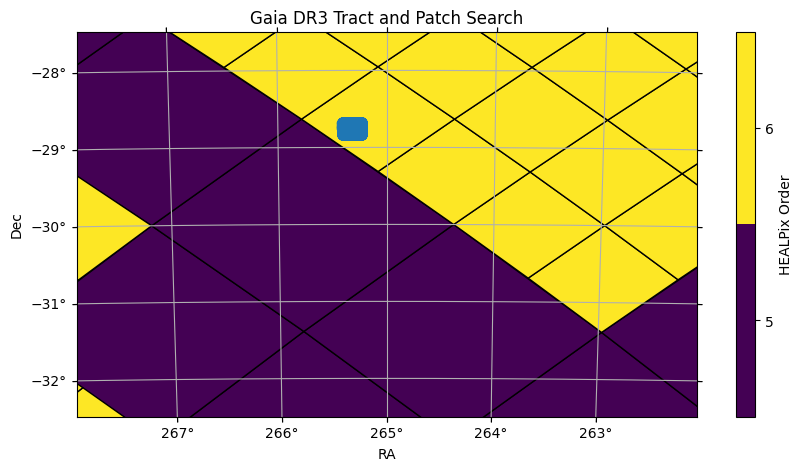
gaia_tract_patch.plot_pixels(
    plot_title="Gaia DR3 Tract and Patch Search",
    fc="#00000000",
    ec="red",
)
[12]:
(<Figure size 1000x500 with 2 Axes>,
 <WCSAxes: title={'center': 'Gaia DR3 Tract and Patch Search'}>)
Plot the points within our patch search
[13]:
df_tract_patch = gaia_tract_patch.compute()
df_tract_patch
/home/delucchi/.virtualenvs/sep/lib/python3.12/site-packages/distributed/client.py:3383: UserWarning: Sending large graph of size 116.78 MiB.
This may cause some slowdown.
Consider loading the data with Dask directly
 or using futures or delayed objects to embed the data into the graph without repetition.
See also https://docs.dask.org/en/stable/best-practices.html#load-data-with-dask for more information.
  warnings.warn(
[13]:
| ra | dec | source_id | |
|---|---|---|---|
| _healpix_29 | |||
| 2030076515776642061 | 265.294515 | -28.840948 | 4060153015792358784 |
| 2030076516438355910 | 265.292557 | -28.839182 | 4060153015802849152 |
| ... | ... | ... | ... |
| 2030095571649978731 | 265.299339 | -28.674579 | 4060191125115382656 |
| 2030095571700128422 | 265.299429 | -28.673891 | 4060191125095778944 |
10543 rows × 3 columns
Zooming in to the same sky area as above, we see only the ~10,000 points that are in the semi-rectangular patch region.
[14]:
fig, ax = gaia.plot_pixels(projection="AIT", fov=fov, center=center, ec="000000")
plot_points.plot_points(
    df_tract_patch,
    ra_column="ra",
    dec_column="dec",
    title="Gaia DR3 Tract and Patch Search",
    fov=fov,
    center=center,
)
[14]:
(<Figure size 1000x500 with 2 Axes>,
 <WCSAxes: title={'center': 'Gaia DR3 Tract and Patch Search'}>)
About
Authors: Olivia Lynn
Last updated on: October 8, 2025
If you use lsdb for published research, please cite following instructions.